Weather Maps API - Map Tiles
The Weather Maps API provides map tiles as 256×256 pixel PNG images that can be overlaid on existing map interfaces. Support for OpenLayers, Leaflets, MapBox, Google Maps, and Cesium allows you to superimpose accurate weather conditions on any map.
Data Availability: Map tiles are available for the last 7 days and for the next 14 days forecast.
Endpoint Details
Endpoint URL Pattern
https://api.tomorrow.io/v4/map/tile/{zoom}/{x}/{y}/{field}/{time}.{format}URL Path Components
- {zoom} - Zoom level (1-12)
- {x} - Tile X coordinate (increases eastward)
- {y} - Tile Y coordinate (increases southward)
- {field} - Weather data field to visualize
- {time} - Time identifier ("now" or ISO timestamp)
- {format} - Image format (png)
Map Tiles Overview
Tile Specifications
- • Size: 256×256 pixel PNG images
- • Coordinate System: Slippy Map tilenames
- • Origin: (0,0) at northwest corner
- • X-axis: Increases eastward
- • Y-axis: Increases southward
Supported Map Libraries
- • OpenLayers
- • Leaflet
- • MapBox
- • Google Maps
- • Cesium
Zoom Levels
Available zoom levels range from 1 to 12. As the zoom level increases, the number of tiles increases exponentially, providing more detailed coverage of smaller geographic areas.
| Level | Number of Tiles | m/pixel (Equator) | Typical Coverage |
|---|---|---|---|
| 0 | 1 | 156,543 | World Wide |
| 1 | 4 | 78,272 | |
| 2 | 16 | 39,136 | Subcontinental area |
| 3 | 64 | 19,568 | Very large country |
| 4 | 256 | 9,784 | Large islands |
| 5 | 1,024 | 4,892 | Large country |
| 6 | 4,096 | 2,446 | Large rivers |
| 7 | 16,384 | 1,223 | US State |
| 8 | 65,536 | 611 | |
| 9 | 262,144 | 305 | Large metropolitan area |
| 10 | 1,048,576 | 152 | Metropolitan area |
| 11 | 4,194,304 | 76 | City |
| 12 | 16,777,216 | 38 | Town |
Tile Grid System
The tile grid follows the Slippy Map tilenames convention used by OpenStreetMap and other web mapping services.
Coordinate Calculation
For any given latitude/longitude coordinate, you can calculate the appropriate tile coordinates using standard web mapping formulas. The grid uses the Web Mercator projection (EPSG:3857).
Weather Map Tile Grid Visualization
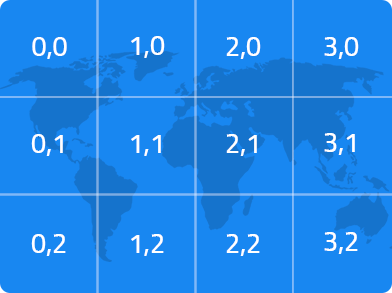
Visual representation of the weather map tile grid system showing tile coordinates and zoom level structure
Reference Information
For detailed information about tile coordinate calculations and implementations in various programming languages, see:
OpenStreetMap Wiki: Slippy Map TilenamesParameters
| Parameter | Type | Required | Description | Example |
|---|---|---|---|---|
zoom | Integer | Required | Zoom level from 1 to 12. Higher zoom levels provide more detailed tiles covering smaller geographic areas. | 5 |
x | Integer | Required | Tile X coordinate. Increases as the map goes east. At zoom level 1, valid range is 0-1. | 2 |
y | Integer | Required | Tile Y coordinate. Increases as the map goes south. At zoom level 1, valid range is 0-1. | 3 |
field | String | Required | Weather data field to visualize on the map tile. Available fields include precipitation, temperature, wind, and more. | precipitationIntensity |
time | String | Required | Time identifier. Use "now" for current conditions, or provide an ISO 8601 timestamp for forecast data. | now |
format | String | Required | Image format for the tile. Currently supports "png". | png |
apikey | String | Required | Your Tomorrow.io API key for authentication. | YOUR_API_KEY |
Request Examples
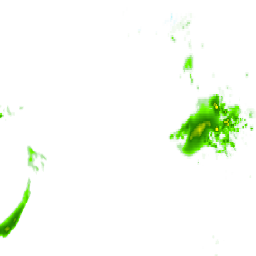
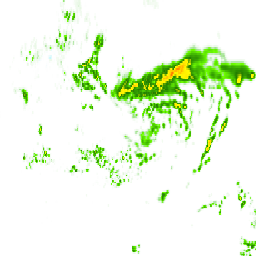
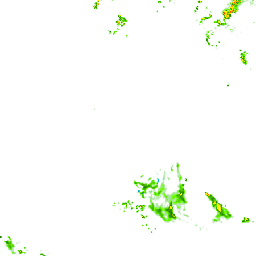
Example 1: Precipitation Intensity
Retrieve a precipitation intensity map tile for zoom level 5, tile coordinates (2,3), showing current conditions:
Request
curl --request GET \
     --url 'https://api.tomorrow.io/v4/map/tile/5/2/3/precipitationIntensity/now.png?apikey=YOUR_API_KEY' \
     --compressed \
     --header 'accept: text/plain' \
     --header 'accept-encoding: deflate, gzip, br'
Response:

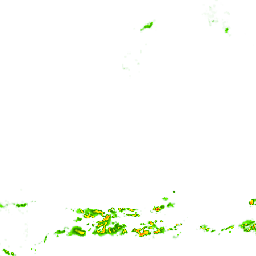
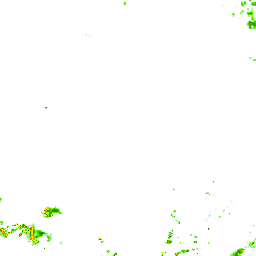
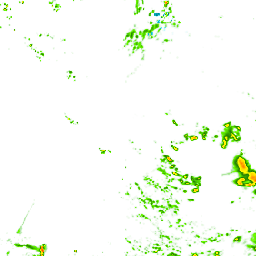
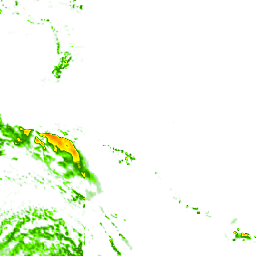
256×256 PNG showing precipitation intensity data
Example 2: Temperature
Retrieve a temperature map tile for zoom level 7, tile coordinates (10,15), showing current conditions:
Request
curl --request GET \
     --url 'https://api.tomorrow.io/v4/map/tile/7/10/15/temperature/now.png?apikey=YOUR_API_KEY' \
     --compressed \
     --header 'accept: text/plain' \
     --header 'accept-encoding: deflate, gzip, br'
Response:

256×256 PNG showing temperature data
Example 3: Wind Speed
Retrieve a wind speed map tile for zoom level 6, tile coordinates (8,12), showing current conditions:
Request
curl --request GET \
     --url 'https://api.tomorrow.io/v4/map/tile/6/8/12/windSpeed/now.png?apikey=YOUR_API_KEY' \
     --compressed \
     --header 'accept: text/plain' \
     --header 'accept-encoding: deflate, gzip, br'
Response:

256×256 PNG showing wind speed data
Response Format
Content-Type: image/png
Dimensions: 256×256 pixels
What You Get:
- High-quality PNG image tiles ready for map overlay
- Weather data visualized with color gradients and transparency
- Properly aligned to standard web mapping tile coordinates
- Compatible with OpenLayers, Leaflet, MapBox, Google Maps, and Cesium
Integration Example: Live Tile Grid
Zoom Level 5: Detailed View (2×2 grid):


Higher zoom = more detail, smaller geographic area per tile
Zoom Level 1: Global View (2×2 grid - Complete World):
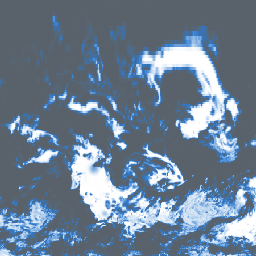
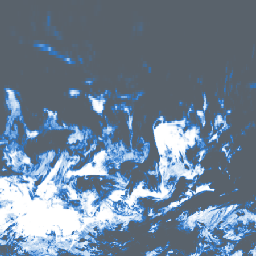

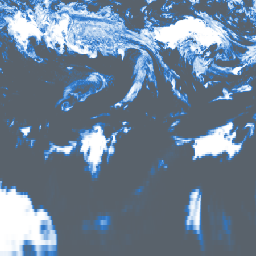
Global scale: These 4 tiles show cloud cover across the entire world
Zoom Level 3: Regional View (3×3 grid):

Lower zoom = broader coverage, larger geographic area per tile
Live Interactive Map Example:
🗺️ Weather Tile Grid Demonstration
- • Pan Only: Drag to explore the tile grid system
- • Each marker shows the center of one 256×256 pixel tile
- • Weather data seamlessly spans across tile boundaries
- • Complete 3×3 grid: X (1-3), Y (0-2) at zoom level 2
💡 Key Point:
Individual tiles combine to create continuous weather visualization
Implementation Code:
// Initialize map with tile grid demonstration settings
const map = L.map('weather-map', {
  center: [66.3728, -0.7031], // Optimized center for 3×3 grid
  zoom: 2, // Zoom level 2 to fit all tiles in viewport
  zoomControl: false, // Disabled for focused demonstration
  scrollWheelZoom: false,
  dragging: true // Allow panning to explore
});

// Add base OpenStreetMap tiles
L.tileLayer('https://{s}.tile.openstreetmap.org/{z}/{x}/{y}.png', {
  attribution: '© OpenStreetMap contributors'
}).addTo(map);

// Create custom tile layer using static prefetched tiles
const WeatherTileLayer = L.TileLayer.extend({
  getTileUrl: function(coords) {
    const x = coords.x, y = coords.y;

    // Serve tiles for demonstration grid (coordinates 1-3, 0-2)
    if (x >= 1 && x <= 3 && y >= 0 && y <= 2) {
      return `/weather-maps/zoom2-grid/tile-${x}-${y}.png`;
    }

    // Return transparent tile for other coordinates
    return 'data:image/png;base64,iVBORw0KGgoAAAANSUhEUgAAAAEAAAABCAYAAAAfFcSJAAAADUlEQVR42mNkYPhfDwAChwGA60e6kgAAAABJRU5ErkJggg==';
  }
});

// Add the weather tile layer with grid boundaries
new WeatherTileLayer({
  opacity: 0.7,
  attribution: 'Weather tiles from Tomorrow.io'
}).addTo(map);